
See our Patterns Dictionary for other patterns.
Check our CandleScanner software and start trading candlestick patterns!
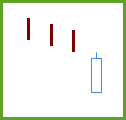
Figure 1. Bullish Belt Hold pattern.
Japanese name: yorikiri
Forecast: bullish reversal
Trend prior to the pattern: downtrend
Opposite pattern: Bearish Belt Hold
Construction:
- white body
- no lower shadow
- short upper shadow
- appears as a long line
Bullish Belt Hold is a one-line pattern formed by the Opening White Marubozu basic candle. There is no source, which would provide the information on how short the upper shadow should be. In CandleScanner, we adopted that it should be no more than 25 percent of the candle. The pattern has to occur in a downtrend.
It rarely changes the trend on the next candle. Pattern rather slows it down, and the turning point occurs in the subsequent nearest candles. However, it is not the rule. As with all one-line patterns, it is worth waiting a few candles for a signal confirmation.
Bullish Belt Hold pattern may occur in combination with another pattern. For example, it can be the second line (Opening White Marubozu appearing as a long line) of such patterns as Bullish Engulfing, Piercing and Three Inside Up patterns. In this case, the more important is the pattern composed of multiple lines. When the Bullish Belt Hold pattern is formed by a very long candle (three times longer than an average length of n last candles), it may create a very strong support zone.

Figure 1. The example shows an unsuccessful attempt to change the trend by Bullish Engulfing pattern, whose second line is the Bullish Belt Hold pattern. The occurrence is accompanied by a large trading volume. The resistance zone that was established by the occurrence of Falling Window pattern and Closing Black Marubozu basic candle is too strong. As a result, the market consolidation began (between $60.28 and $61.22), because the Opening White Marubozu candle created a support zone.

Figure 2. The region between two occurrences of Black Candles constitutes strong resistance zone hard to beat. Heavy downtrend is stopped by bulls at high trading volume.
Then Bullish Harami pattern occurs that ends the downtrend. Appearance of Bullish Engulfing pattern where the second line is forming Bullish Belt Hold pattern, accompanied by the very high trading volume creates strong support zone. That region allows bulls to attack and reverse the downtrend. Finally, the trend has been overcome by Turn Up pattern, but the resistance band created by Black Candle is too tough to surpass.
Bullish Belt Hold statistics
Below you can find some Bullish Belt Hold pattern statistics calculated by CandleScanner software. To see more detailed statistics, for other markets and periodicity try our CandleScanner software. Prices start at only $10, and you can see more detailed statistics, for other markets and periodicity. Click here to find out more!
Scanner settings: daily stocks
Group: S&P500
Number of symbols: 502
Date range: 7/1/1995 - 6/30/2015
Time interval: daily candles
Total number of candlesticks: 2,236,421
Number of occurrences (Bullish Belt Hold): 6,020
Number of occurrences (all candlestick patterns): 638,570
% of occurrences (Bullish Belt Hold): 0.94 %
Average frequency: 371.5
Efficiency statistics (5 candlesticks testing period)
| Efficiency | NO DATA | FALSE | LOW | MEDIUM | HIGH |
|---|---|---|---|---|---|
| Number of Occurrences |
0 | 1,099 | 1,566 | 1,172 | 2,183 |
| % of Occurrences |
0.00 % | 18.26 % | 26.01 % | 19.47 % | 36.26 % |
| Efficiency | NO DATA | FALSE | LOW | MEDIUM | HIGH |
|---|---|---|---|---|---|
| Number of Occurrences |
1 | 1,051 | 1,240 | 973 | 2,755 |
| % of Occurrences |
0.02 % | 17.44 % | 20.60 % | 16.16 % | 45.78 % |
| Occurrences Statistics | 5 candlesticks testing period (HIGH efficiency) |
10 candlesticks testing period (HIGH efficiency) |
||||
|---|---|---|---|---|---|---|
| Symbol | Number of Occurrences |
Average Frequency |
Number of Occurrences |
% of Occurrences |
Number of Occurrences |
% of Occurrences |
| HUM | 19 | 264.9 | 14 | 73.68 % | 15 | 78.95 % |
| DHR | 22 | 228.8 | 13 | 59.09 % | 17 | 77.27 % |
| TIF | 17 | 296.1 | 8 | 47.06 % | 12 | 70.59 % |
| HPQ | 17 | 296.1 | 10 | 58.83 % | 12 | 70.59 % |
| TMO | 20 | 251.7 | 10 | 50.00 % | 14 | 70.00 % |
| A | 19 | 206.7 | 9 | 47.37 % | 13 | 68.42 % |
| PCG | 19 | 264.9 | 11 | 57.89 % | 13 | 68.42 % |
| DVA | 23 | 215.2 | 14 | 60.87 % | 15 | 65.22 % |
| PNC | 20 | 251.7 | 10 | 50.00 % | 13 | 65.00 % |
| RL | 20 | 227.1 | 13 | 65.00 % | 13 | 65.00 % |
| Occurrences Statistics | 5 candlesticks testing period (FALSE efficiency) |
10 candlesticks testing period (FALSE efficiency) |
||||
|---|---|---|---|---|---|---|
| Symbol | Number of Occurrences |
Average Frequency |
Number of Occurrences |
% of Occurrences |
Number of Occurrences |
% of Occurrences |
| CMS | 17 | 296.1 | 7 | 41.18 % | 7 | 41.18 % |
| AGN | 18 | 279.7 | 7 | 38.89 % | 7 | 38.89 % |
| NFX | 22 | 228.6 | 8 | 36.36 % | 8 | 36.36 % |
| CNX | 20 | 203.5 | 7 | 35.00 % | 7 | 35.00 % |
| ACE | 19 | 264.9 | 6 | 31.58 % | 6 | 31.58 % |
| AN | 19 | 264.9 | 6 | 31.58 % | 6 | 31.58 % |
| AES | 20 | 251.7 | 6 | 30.00 % | 6 | 30.00 % |
| DVN | 20 | 251.7 | 6 | 30.00 % | 6 | 30.00 % |
| FLIR | 17 | 296.1 | 5 | 29.41 % | 5 | 29.41 % |
| MHK | 17 | 296.1 | 5 | 29.41 % | 5 | 29.41 % |
Scanner settings: daily stocks
Group: S&P500
Number of symbols: 502
Date range: 7/1/2010 - 6/30/2015
Time interval: daily candles
Total number of candlesticks: 614,034
Number of occurrences (Bullish Belt Hold): 991
Number of occurrences (all candlestick patterns): 166,328
% of occurrences (Bullish Belt Hold): 0.60 %
Average frequency: 619.6
Efficiency statistics (5 candlesticks testing period)
| Efficiency | NO DATA | FALSE | LOW | MEDIUM | HIGH |
|---|---|---|---|---|---|
| Number of Occurrences |
0 | 107 | 325 | 233 | 326 |
| % of Occurrences |
0.00 % | 10.80 % | 32.80 % | 23.51 % | 32.89 % |
| Efficiency | NO DATA | FALSE | LOW | MEDIUM | HIGH |
|---|---|---|---|---|---|
| Number of Occurrences |
1 | 93 | 247 | 199 | 451 |
| % of Occurrences |
0.10 % | 9.28 % | 24.92 % | 20.08 % | 45.62 % |
| Occurrences Statistics | 5 candlesticks testing period (HIGH efficiency) |
10 candlesticks testing period (HIGH efficiency) |
||||
|---|---|---|---|---|---|---|
| Symbol | Number of Occurrences |
Average Frequency |
Number of Occurrences |
% of Occurrences |
Number of Occurrences |
% of Occurrences |
| CTSH | 6 | 209.7 | 4 | 66.67 % | 4 | 66.67 % |
| RL | 6 | 209.7 | 4 | 66.67 % | 4 | 66.67 % |
| AAP | 6 | 209.7 | 4 | 66.66 % | 4 | 66.66 % |
| BF.B | 5 | 251.6 | 0 | 0.00 % | 3 | 60.00 % |
| NVDA | 5 | 251.6 | 2 | 40.00 % | 3 | 60.00 % |
| AN | 5 | 251.6 | 2 | 40.00 % | 3 | 60.00 % |
| HPQ | 5 | 251.6 | 3 | 60.00 % | 3 | 60.00 % |
| ROP | 5 | 251.6 | 3 | 60.00 % | 3 | 60.00 % |
| SHW | 5 | 251.6 | 2 | 40.00 % | 3 | 60.00 % |
| BIIB | 6 | 209.7 | 1 | 16.67 % | 3 | 50.00 % |
| Occurrences Statistics | 5 candlesticks testing period (FALSE efficiency) |
10 candlesticks testing period (FALSE efficiency) |
||||
|---|---|---|---|---|---|---|
| Symbol | Number of Occurrences |
Average Frequency |
Number of Occurrences |
% of Occurrences |
Number of Occurrences |
% of Occurrences |
| CTXS | 5 | 251.6 | 2 | 40.00 % | 2 | 40.00 % |
| EXPD | 5 | 251.6 | 2 | 40.00 % | 2 | 40.00 % |
| CTSH | 6 | 209.7 | 2 | 33.33 % | 2 | 33.33 % |
| ADM | 5 | 251.6 | 1 | 20.00 % | 1 | 20.00 % |
| CF | 5 | 251.6 | 1 | 20.00 % | 1 | 20.00 % |
| LLTC | 5 | 251.6 | 1 | 20.00 % | 1 | 20.00 % |
| NVDA | 5 | 251.6 | 1 | 20.00 % | 1 | 20.00 % |
| PDCO | 5 | 251.6 | 2 | 40.00 % | 1 | 20.00 % |
| PEG | 5 | 251.6 | 1 | 20.00 % | 1 | 20.00 % |
| UTX | 5 | 251.6 | 1 | 20.00 % | 1 | 20.00 % |

