
See our Patterns Dictionary for other patterns.
Check our CandleScanner software and start trading candlestick patterns!
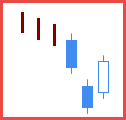
Figure 1. Downside Gap Three Methods pattern.
Japanese name: kyoku no santen boshi
Forecast: bearish continuation
Trend prior to the pattern: downtrend
Opposite pattern: Upside Gap Three Methods
Construction:
- First candle
- a candle in a downtrend
- black body
- Second candle
- black body
- the high below the prior low (gap)
- Third candle
- white body
- the opening price within the prior body
- the closing price within the body of the first line (gap close)
The Downside Gap Three Methods is a three-line bearish continuation pattern. It is a variant of the Downside Tasuki Gap pattern, but the price gap between the two black candles is closed.
Although the price gap between the two black candles is closed, the pattern is classified as a bearish continuation one. The pattern should be confirmed, that is the price should move below the second line closing price. In other words, the third line being white candle needs to be negated.
Two last lines may form the Bullish Tasuki Line pattern which is a bullish reversal pattern. If such situation happens, then the market context should play the most important factor.

Figure 2. The Downside Gap Three Methods appears very rarely on the candlestick charts therefore it is difficult to provide a reliable performance statistics.
The pattern has an interesting construction. Its first two lines are bearish, whereas the third line is a white candle closing the price gap (forming the Falling Window pattern), which indicates optimism among the bulls. Nevertheless, the pattern is classified as a bearish continuation one. Confirmation of the pattern is highly recommended.
On the chart, we can see that the White Candle being the third line of a Downside Gap Three Methods is followed by a candle opening below the White Candle opening price. A long upper shadow should be seen however as a warning, especially if we cannot see what happened during the day on the intraday chart.
The bottom line is that due to the third line of the Downside Gap Three Methods it should be traded with caution.
Downside Gap Three Methods statistics
Below you can find some Downside Gap Three Methods pattern statistics calculated by CandleScanner software.
Scanner settings: daily stocks
Group: S&P500
Number of symbols: 502
Date range: 7/1/1995 - 6/30/2015
Time interval: daily candles
Total number of candlesticks: 2,236,421
Number of occurrences (Downside Gap Three Methods): 145
Number of occurrences (all candlestick patterns): 638,570
% of occurrences (Downside Gap Three Methods): 0.02 %
Average frequency: 15,423.6
Efficiency statistics (5 candlesticks testing period)
| Efficiency | NO DATA | FALSE | LOW | MEDIUM | HIGH |
|---|---|---|---|---|---|
| Number of Occurrences |
0 | 24 | 36 | 30 | 55 |
| % of Occurrences |
0.00 % | 16.55 % | 24.83 % | 20.69 % | 37.93 % |
| Efficiency | NO DATA | FALSE | LOW | MEDIUM | HIGH |
|---|---|---|---|---|---|
| Number of Occurrences |
0 | 22 | 31 | 26 | 66 |
| % of Occurrences |
0.00 % | 15.17 % | 21.38 % | 17.93 % | 45.52 % |
| Occurrences Statistics | 5 candlesticks testing period (HIGH efficiency) |
10 candlesticks testing period (HIGH efficiency) |
||||
|---|---|---|---|---|---|---|
| Symbol | Number of Occurrences |
Average Frequency |
Number of Occurrences |
% of Occurrences |
Number of Occurrences |
% of Occurrences |
| AA | 2 | 2,517.0 | 2 | 100.00 % | 2 | 100.00 % |
| AIZ | 1 | 2,870.0 | 1 | 100.00 % | 1 | 100.00 % |
| AMP | 1 | 2,452.0 | 1 | 100.00 % | 1 | 100.00 % |
| AVGO | 1 | 1,485.0 | 1 | 100.00 % | 1 | 100.00 % |
| CNX | 1 | 4,069.0 | 1 | 100.00 % | 1 | 100.00 % |
| GS | 1 | 4,066.0 | 1 | 100.00 % | 1 | 100.00 % |
| MA | 1 | 2,290.0 | 1 | 100.00 % | 1 | 100.00 % |
| MAR | 1 | 4,347.0 | 1 | 100.00 % | 1 | 100.00 % |
| MON | 1 | 3,696.0 | 1 | 100.00 % | 1 | 100.00 % |
| NLSN | 1 | 1,113.0 | 1 | 100.00 % | 1 | 100.00 % |
| Occurrences Statistics | 5 candlesticks testing period (FALSE efficiency) |
10 candlesticks testing period (FALSE efficiency) |
||||
|---|---|---|---|---|---|---|
| Symbol | Number of Occurrences |
Average Frequency |
Number of Occurrences |
% of Occurrences |
Number of Occurrences |
% of Occurrences |
| CF | 1 | 2,488.0 | 1 | 100.00 % | 1 | 100.00 % |
| DVN | 2 | 2,517.0 | 2 | 100.00 % | 2 | 100.00 % |
| GME | 1 | 3,368.0 | 1 | 100.00 % | 1 | 100.00 % |
| ICE | 1 | 2,420.0 | 1 | 100.00 % | 1 | 100.00 % |
| NVDA | 1 | 4,136.0 | 1 | 100.00 % | 1 | 100.00 % |
| HOG | 2 | 2,517.0 | 1 | 50.00 % | 1 | 50.00 % |
| SNDK | 2 | 2,472.0 | 1 | 50.00 % | 1 | 50.00 % |
| LLL | 3 | 1,435.7 | 1 | 33.33 % | 1 | 33.33 % |
Scanner settings: daily stocks
Group: S&P500
Number of symbols: 502
Date range: 7/1/2010 - 6/30/2015
Time interval: daily candles
Total number of candlesticks: 614,034
Number of occurrences (Downside Gap Three Methods): 36
Number of occurrences (all candlestick patterns): 166,328
% of occurrences (Downside Gap Three Methods): 0.02 %
Average frequency: 17,056.5
Efficiency statistics (5 candlesticks testing period)
| Efficiency | NO DATA | FALSE | LOW | MEDIUM | HIGH |
|---|---|---|---|---|---|
| Number of Occurrences |
0 | 2 | 10 | 12 | 12 |
| % of Occurrences |
0.00 % | 5.56 % | 27.78 % | 33.33 % | 33.33 % |
| Efficiency | NO DATA | FALSE | LOW | MEDIUM | HIGH |
|---|---|---|---|---|---|
| Number of Occurrences |
0 | 1 | 10 | 12 | 13 |
| % of Occurrences |
0.00 % | 2.78 % | 27.78 % | 33.33 % | 36.11 % |
| Occurrences Statistics | 5 candlesticks testing period (HIGH efficiency) |
10 candlesticks testing period (HIGH efficiency) |
||||
|---|---|---|---|---|---|---|
| Symbol | Number of Occurrences |
Average Frequency |
Number of Occurrences |
% of Occurrences |
Number of Occurrences |
% of Occurrences |
| NLSN | 1 | 1,113.0 | 1 | 100.00 % | 1 | 100.00 % |

