
See our Patterns Dictionary for other patterns.
Check our CandleScanner software and start trading candlestick patterns!
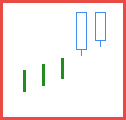
Figure 1. Matching High pattern.
Japanese name: niten tenjo
Forecast: bearish reversal
Trend prior to the pattern: uptrend
Opposite pattern: Matching Low
Construction:
- First candle
- a candle in an uptrend
- white body
- no upper shadow
- appears as a long line
- Second candle
- white body
- the opening price is above the previous opening price
- the closing price is at the level of the previous closing price
- no upper shadow
The Matching High is built of two marubozu candles having white bodies. In other words, it can be a White Marubozu or a Closing White Marubozu.
The first line of the pattern appears as a long line whereas the second one can be either long or short. Both candle lines need to close at the same level. Additionally, the opening of the second candle need to be higher than the opening of the previous candle.
The Matching High belongs to the bullish reversal patterns group. Its appearance on the chart should be confirmed on the following candles, that is, either breaking out the nearest support zone, which can be formed by the first line of a Matching High pattern. The best confirmation is in the form of a black candle that the closing price is below the opening price of the first pattern's line.

Figure 2. Likewise the Matching Low, the Matching High requires marubozu candles for both lines. In the case of the Matching High, it should be either a White Marubozu or a Closing White Marubozu. The pattern was introduced by Greg Morris as a bearish counterpart to the Matching Low pattern.
In general the Matching High pattern is among the least frequently occurring ones. If to relax slightly the pattern's requirements and allow the upper shadows, we would have many more occurrences. Then assessing the pattern statistics would have much more sense.
On the chart, we see a Matching Low pattern being confirmed on the following candles. The appearance of a Long Black Candle demonstrates that the bulls have control of the market.
Matching High statistics
Below you can find some Matching High pattern statistics calculated by CandleScanner software. To see more detailed statistics, for other markets and periodicity try our CandleScanner software. Prices start at only $10, and you can see more detailed statistics, for other markets and periodicity. Click here to find out more!
Scanner settings: daily stocks
Group: S&P500
Number of symbols: 502
Date range: 7/1/1995 - 6/30/2015
Time interval: daily candles
Total number of candlesticks: 2,236,421
Number of occurrences (Matching High): 155
Number of occurrences (all candlestick patterns): 638,570
% of occurrences (Matching High): 0.02 %
Average frequency: 14,428.5
Efficiency statistics (5 candlesticks testing period)
| Efficiency | NO DATA | FALSE | LOW | MEDIUM | HIGH |
|---|---|---|---|---|---|
| Number of Occurrences |
0 | 21 | 64 | 29 | 41 |
| % of Occurrences |
0.00 % | 13.55 % | 41.29 % | 18.71 % | 26.45 % |
| Efficiency | NO DATA | FALSE | LOW | MEDIUM | HIGH |
|---|---|---|---|---|---|
| Number of Occurrences |
0 | 19 | 50 | 29 | 57 |
| % of Occurrences |
0.00 % | 12.26 % | 32.26 % | 18.71 % | 36.77 % |
| Occurrences Statistics | 5 candlesticks testing period (HIGH efficiency) |
10 candlesticks testing period (HIGH efficiency) |
||||
|---|---|---|---|---|---|---|
| Symbol | Number of Occurrences |
Average Frequency |
Number of Occurrences |
% of Occurrences |
Number of Occurrences |
% of Occurrences |
| ABC | 2 | 2,517.0 | 1 | 50.00 % | 2 | 100.00 % |
| D | 2 | 2,517.0 | 1 | 50.00 % | 2 | 100.00 % |
| LH | 2 | 2,517.0 | 1 | 50.00 % | 2 | 100.00 % |
| TSCO | 3 | 1,667.7 | 3 | 100.00 % | 3 | 100.00 % |
| TSO | 2 | 2,517.0 | 2 | 100.00 % | 2 | 100.00 % |
| MNST | 4 | 1,093.8 | 3 | 75.00 % | 3 | 75.00 % |
| MRO | 3 | 1,678.0 | 1 | 33.33 % | 2 | 66.67 % |
| ECL | 2 | 2,517.0 | 1 | 50.00 % | 1 | 50.00 % |
| FLS | 2 | 2,517.0 | 1 | 50.00 % | 1 | 50.00 % |
| FTR | 2 | 2,517.0 | 1 | 50.00 % | 1 | 50.00 % |
| Occurrences Statistics | 5 candlesticks testing period (FALSE efficiency) |
10 candlesticks testing period (FALSE efficiency) |
||||
|---|---|---|---|---|---|---|
| Symbol | Number of Occurrences |
Average Frequency |
Number of Occurrences |
% of Occurrences |
Number of Occurrences |
% of Occurrences |
| DOV | 1 | 5,034.0 | 1 | 100.00 % | 1 | 100.00 % |
| ESRX | 1 | 5,033.0 | 1 | 100.00 % | 1 | 100.00 % |
| ETN | 1 | 5,034.0 | 1 | 100.00 % | 1 | 100.00 % |
| GGP | 1 | 5,034.0 | 1 | 100.00 % | 1 | 100.00 % |
| HAR | 1 | 5,034.0 | 1 | 100.00 % | 1 | 100.00 % |
| MCD | 1 | 5,034.0 | 1 | 100.00 % | 1 | 100.00 % |
| TMK | 1 | 5,034.0 | 1 | 100.00 % | 1 | 100.00 % |
| URBN | 1 | 5,028.0 | 1 | 100.00 % | 1 | 100.00 % |
| PLL | 2 | 2,517.0 | 1 | 50.00 % | 1 | 50.00 % |
| SCG | 2 | 2,517.0 | 1 | 50.00 % | 1 | 50.00 % |
Scanner settings: daily stocks
Group: S&P500
Number of symbols: 502
Date range: 7/1/2010 - 6/30/2015
Time interval: daily candles
Total number of candlesticks: 614,034
Number of occurrences (Matching High): 1
Number of occurrences (all candlestick patterns): 166,328
% of occurrences (Matching High): 0.00 %
Average frequency: 614,034.0
Efficiency statistics (5 candlesticks testing period)
| Efficiency | NO DATA | FALSE | LOW | MEDIUM | HIGH |
|---|---|---|---|---|---|
| Number of Occurrences |
0 | 0 | 1 | 0 | 0 |
| % of Occurrences |
0.00 % | 0.00 % | 100.00 % | 0.00 % | 0.00 % |
| Efficiency | NO DATA | FALSE | LOW | MEDIUM | HIGH |
|---|---|---|---|---|---|
| Number of Occurrences |
0 | 0 | 0 | 1 | 0 |
| % of Occurrences |
0.00 % | 0.00 % | 0.00 % | 100.00 % | 0.00 % |
| Occurrences Statistics | 5 candlesticks testing period (HIGH efficiency) |
10 candlesticks testing period (HIGH efficiency) |
||||
|---|---|---|---|---|---|---|
| Symbol | Number of Occurrences |
Average Frequency |
Number of Occurrences |
% of Occurrences |
Number of Occurrences |
% of Occurrences |
| PG | 1 | 1,258.0 | 0 | 0.00 % | 0 | 0.00 % |
| Occurrences Statistics | 5 candlesticks testing period (FALSE efficiency) |
10 candlesticks testing period (FALSE efficiency) |
||||
|---|---|---|---|---|---|---|
| Symbol | Number of Occurrences |
Average Frequency |
Number of Occurrences |
% of Occurrences |
Number of Occurrences |
% of Occurrences |
| PG | 1 | 1,258.0 | 0 | 0.00 % | 0 | 0.00 % |

