
See our Patterns Dictionary for other patterns.
Check our CandleScanner software and start trading candlestick patterns!
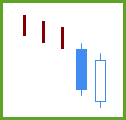
Figure 1. Piercing pattern.
Japanese name: kirikomi
Forecast: bullish reversal
Trend prior to the pattern: downtrend
Opposite pattern: Dark Cloud Cover
Construction:
- First candle
- a candle in a downtrend
- black body
- Second candle
- white body
- the opening below or equal of the prior low
- the closing above the midpoint of the prior candle's body
- the closing below the previous opening
The Piercing is a bullish equivalent pattern of the bearish Dark Cloud Cover.
The first day of the pattern is a black candle appearing as a long line in a downtrend, except spinning tops and doji candles. In other words, the first line can be one of the following basic candles: Black Candle, Long Black Candle, Black Marubozu, Opening Black Marubozu, Closing Black Marubozu.
The candle of the second line is exactly opposite to the first line, i.e. it can be one of the following basic candles: White Candle, Long White Candle, White Marubozu, Opening White Marubozu, Closing White Marubozu. The second line's candle needs to appear as a long line. Its opening must be lower than the low of the prior candle. However, it is acceptable that both prices are equal. The closing price of the second candle must be located between the midpoint and the open of the previous candle.
The Piercing pattern can be seen as a classic reversal pattern due to its look. Price gaps downwards after the first black candle, however, the market demonstrates its strength and closes above the midpoint of the first line.
On the stock market, the pattern reliability is higher when an increase in trading volume can be observed on the second line.
As every other pattern, the Piercing pattern should be confirmed by the following candles. Confirmation may be for example in the form of breaking out of a support zone or a trend line. If a Piercing pattern is confirmed, then its second line acts as a support area.

Figure 2. The appearance of a Long Black Candle on the chart confirms a downtrend, making a resistance area stronger. A Piercing pattern then tries to slow down the downtrend. It is important to notice that always its second line (long white body in this case) creates a support zone. The occurrence of a White Spinning Top breaks out of the downtrend, confirming the Piercing pattern.
The mentioned Long Black Candle, however, is stopping the market from reaching new highs.
Attention should be paid to (1) Long White Candle, which opened significantly below the level of the second line of the Piercing pattern. However, the bulls managed to close the candle much higher, confirming the support zone formed by the second line of the Piercing pattern.

Figure 3. The occurrence of a Piercing pattern is preceded by a Falling Window. The strength of the bears forming the Falling Window is very significant because they managed to create an enormous price gap at a high trading volume. After that, the bulls to be successful would have to respond in the form of 2-3 strong upward moves.
The second line of the Piercing created a support zone, which helped to avoid further price drops.
It is not visible on the chart, but the market broke out of the resistance zone formed by the Falling Window three months later. In general gaps (e.g. Falling Window) are creating strong resistance zones and they should not be ignored.
Piercing statistics
Below you can find some Piercing pattern statistics calculated by CandleScanner software. To see more detailed statistics, for other markets and periodicity try our CandleScanner software. Prices start at only $10, and you can see more detailed statistics, for other markets and periodicity. Click here to find out more!
Scanner settings: daily stocks
Group: S&P500
Number of symbols: 502
Date range: 7/1/1995 - 6/30/2015
Time interval: daily candles
Total number of candlesticks: 2,236,421
Number of occurrences (Piercing): 3,207
Number of occurrences (all candlestick patterns): 638,570
% of occurrences (Piercing): 0.50 %
Average frequency: 697.4
Efficiency statistics (5 candlesticks testing period)
| Efficiency | NO DATA | FALSE | LOW | MEDIUM | HIGH |
|---|---|---|---|---|---|
| Number of Occurrences |
4 | 642 | 799 | 584 | 1,178 |
| % of Occurrences |
0.12 % | 19.90 % | 24.91 % | 18.21 % | 36.86 % |
| Efficiency | NO DATA | FALSE | LOW | MEDIUM | HIGH |
|---|---|---|---|---|---|
| Number of Occurrences |
5 | 625 | 637 | 494 | 1,446 |
| % of Occurrences |
0.16 % | 19.33 % | 19.86 % | 15.40 % | 45.25 % |
| Occurrences Statistics | 5 candlesticks testing period (HIGH efficiency) |
10 candlesticks testing period (HIGH efficiency) |
||||
|---|---|---|---|---|---|---|
| Symbol | Number of Occurrences |
Average Frequency |
Number of Occurrences |
% of Occurrences |
Number of Occurrences |
% of Occurrences |
| MAS | 7 | 719.1 | 7 | 100.00 % | 7 | 100.00 % |
| SWN | 8 | 629.3 | 6 | 75.00 % | 7 | 87.50 % |
| AET | 7 | 719.1 | 6 | 85.71 % | 6 | 85.71 % |
| MRO | 11 | 457.6 | 7 | 63.64 % | 9 | 81.82 % |
| COP | 10 | 503.4 | 8 | 80.00 % | 8 | 80.00 % |
| AKAM | 8 | 492.6 | 6 | 75.00 % | 6 | 75.00 % |
| COST | 8 | 629.3 | 3 | 37.50 % | 6 | 75.00 % |
| DNB | 8 | 464.8 | 3 | 37.50 % | 6 | 75.00 % |
| GMCR | 8 | 623.1 | 5 | 62.50 % | 6 | 75.00 % |
| HAS | 8 | 629.3 | 5 | 62.50 % | 6 | 75.00 % |
| Occurrences Statistics | 5 candlesticks testing period (FALSE efficiency) |
10 candlesticks testing period (FALSE efficiency) |
||||
|---|---|---|---|---|---|---|
| Symbol | Number of Occurrences |
Average Frequency |
Number of Occurrences |
% of Occurrences |
Number of Occurrences |
% of Occurrences |
| NTAP | 9 | 548.2 | 6 | 66.67 % | 6 | 66.67 % |
| SWKS | 10 | 503.4 | 6 | 60.00 % | 6 | 60.00 % |
| NUE | 7 | 719.1 | 4 | 57.14 % | 4 | 57.14 % |
| ROST | 7 | 719.1 | 4 | 57.14 % | 4 | 57.14 % |
| SBUX | 7 | 719.1 | 4 | 57.14 % | 4 | 57.14 % |
| TYC | 7 | 719.1 | 4 | 57.14 % | 4 | 57.14 % |
| D | 9 | 559.3 | 5 | 55.56 % | 5 | 55.56 % |
| FLS | 11 | 457.6 | 6 | 54.55 % | 6 | 54.55 % |
| IVZ | 8 | 623.5 | 4 | 50.00 % | 4 | 50.00 % |
| RF | 13 | 387.2 | 6 | 46.15 % | 6 | 46.15 % |
Scanner settings: daily stocks
Group: S&P500
Number of symbols: 502
Date range: 7/1/2010 - 6/30/2015
Time interval: daily candles
Total number of candlesticks: 614,034
Number of occurrences (Piercing): 755
Number of occurrences (all candlestick patterns): 166,328
% of occurrences (Piercing): 0.45 %
Average frequency: 813.3
Efficiency statistics (5 candlesticks testing period)
| Efficiency | NO DATA | FALSE | LOW | MEDIUM | HIGH |
|---|---|---|---|---|---|
| Number of Occurrences |
4 | 113 | 232 | 143 | 263 |
| % of Occurrences |
0.53 % | 14.44 % | 30.73 % | 18.94 % | 35.36 % |
| Efficiency | NO DATA | FALSE | LOW | MEDIUM | HIGH |
|---|---|---|---|---|---|
| Number of Occurrences |
5 | 106 | 171 | 137 | 336 |
| % of Occurrences |
0.66 % | 13.38 % | 22.65 % | 18.15 % | 45.16 % |
| Occurrences Statistics | 5 candlesticks testing period (HIGH efficiency) |
10 candlesticks testing period (HIGH efficiency) |
||||
|---|---|---|---|---|---|---|
| Symbol | Number of Occurrences |
Average Frequency |
Number of Occurrences |
% of Occurrences |
Number of Occurrences |
% of Occurrences |
| AET | 2 | 629.0 | 2 | 100.00 % | 2 | 100.00 % |
| AKAM | 3 | 419.3 | 3 | 100.00 % | 3 | 100.00 % |
| AMZN | 2 | 629.0 | 2 | 100.00 % | 2 | 100.00 % |
| AN | 2 | 629.0 | 1 | 50.00 % | 2 | 100.00 % |
| APH | 2 | 629.0 | 2 | 100.00 % | 2 | 100.00 % |
| BEN | 3 | 419.3 | 3 | 100.00 % | 3 | 100.00 % |
| CBG | 2 | 629.0 | 1 | 50.00 % | 2 | 100.00 % |
| CCL | 2 | 629.0 | 2 | 100.00 % | 2 | 100.00 % |
| COST | 2 | 629.0 | 1 | 50.00 % | 2 | 100.00 % |
| CSC | 2 | 629.0 | 2 | 100.00 % | 2 | 100.00 % |
| Occurrences Statistics | 5 candlesticks testing period (FALSE efficiency) |
10 candlesticks testing period (FALSE efficiency) |
||||
|---|---|---|---|---|---|---|
| Symbol | Number of Occurrences |
Average Frequency |
Number of Occurrences |
% of Occurrences |
Number of Occurrences |
% of Occurrences |
| BWA | 3 | 419.3 | 2 | 66.67 % | 2 | 66.67 % |
| NTAP | 3 | 419.3 | 2 | 66.67 % | 2 | 66.67 % |
| SLB | 3 | 419.3 | 2 | 66.67 % | 2 | 66.67 % |
| SYY | 3 | 419.3 | 2 | 66.67 % | 2 | 66.67 % |
| ADT | 2 | 350.0 | 1 | 50.00 % | 1 | 50.00 % |
| AMG | 2 | 629.0 | 1 | 50.00 % | 1 | 50.00 % |
| BIIB | 2 | 629.0 | 1 | 50.00 % | 1 | 50.00 % |
| BK | 2 | 629.0 | 1 | 50.00 % | 1 | 50.00 % |
| BXP | 2 | 629.0 | 1 | 50.00 % | 1 | 50.00 % |
| CCE | 2 | 629.0 | 1 | 50.00 % | 1 | 50.00 % |

