
See our Patterns Dictionary for other patterns.
Check our CandleScanner software and start trading candlestick patterns!
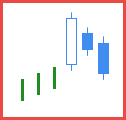
Figure 1. Three Inside Down pattern.
Forecast: bearish reversal
Trend prior to the pattern: uptrend
Opposite pattern: Three Inside Up
See also: Bearish Harami
Construction:
- First candle
- a candle in an uptrend
- white body
- Second candle
- black body
- the candle body is engulfed by the prior candle body
- Third candle
- the closing price is below the previous closing price
The Three Inside Down three-line pattern is introduced by Gregory Morris as an extension of the Bearish Harami pattern.
Its first line is any candle having a white body, appearing as a long line, that is White Candle, Long White Candle, White Marubozu, Opening White Marubozu or Closing White Marubozu. The second line is any black candle except the doji candles. Additionally the second line body needs to be engulfed by the first line body.
The opening price of the second line may be equal to the first candle's closing price. The closing price of the second line may be equal to the opening price of the first candle. These two situations cannot happen at the same time, however.
The third candle of the pattern may be formed by any candle having a black body except the doji candles, closing below the second candle's closing price.
The shadows do not matter in the case of this pattern.
The first line of the pattern may act as a support area.
The Three Inside Down pattern should be confirmed. Confirmation can be in the form of breaking the nearest support zone or a trendline.
Figure 2. The Three Inside Down pattern, built of three lines, was introduced by Gregory Morris as a confirmation of the Bearish Harami pattern, constructed of 2 lines.
While discussing the Bearish Harami pattern, we paid attention to the fact that the first line is forming a support zone which needs to be broken.
A similar situation exists with the Three Inside Down -- if the third line closes below the first line, we can say that a pattern is confirmed. Such case is illustrated on the chart.
Within a downtrend prior a Bearish Harami pattern, two White Candles are formed. They are important because form a support zone. Also, it's worth to notice that these two candles appeared at a high trading volume.
For some traders, it's enough that a Bearish Harami appears, to open a position. However, that's not what we recommend.
The day following the Bearish Harami pattern opens slightly (by $0.01) above the prior closing price, but closes below the first line. Appearance of a Turn Down pattern confirms that the bears have control.

Figure 3. Yet another example showing that the market needs to close below the first line of a Bearish Harami and Three Inside Down patterns in order to confirm the bearish signal.
On the chart, we can see an Opening White Marubozu (1), being the first line of the Bearish Harami and Three Inside Down. This candle forms a support zone, which as we can see worked well -- the market failed to move price below it. Appearance of the Opening White Marubozu (2) confirms the mentioned support area and the stock moved sideways.
Three Inside Down statistics
Below you can find some Three Inside Down pattern statistics calculated by CandleScanner software. To see more detailed statistics, for other markets and periodicity try our CandleScanner software. Prices start at only $10, and you can see more detailed statistics, for other markets and periodicity. Click here to find out more!
Scanner settings: daily stocks
Group: S&P500
Number of symbols: 502
Date range: 7/1/1995 - 6/30/2015
Time interval: daily candles
Total number of candlesticks: 2,236,421
Number of occurrences (Three Inside Down): 16,349
Number of occurrences (all candlestick patterns): 638,570
% of occurrences (Three Inside Down): 2.56 %
Average frequency: 136.8
Efficiency statistics (5 candlesticks testing period)
| Efficiency | NO DATA | FALSE | LOW | MEDIUM | HIGH |
|---|---|---|---|---|---|
| Number of Occurrences |
7 | 3,019 | 5,227 | 3,281 | 4,815 |
| % of Occurrences |
0.04 % | 18.43 % | 31.97 % | 20.07 % | 29.49 % |
| Efficiency | NO DATA | FALSE | LOW | MEDIUM | HIGH |
|---|---|---|---|---|---|
| Number of Occurrences |
27 | 2,825 | 4,305 | 2,911 | 6,281 |
| % of Occurrences |
0.17 % | 17.11 % | 26.33 % | 17.81 % | 38.58 % |
| Occurrences Statistics | 5 candlesticks testing period (HIGH efficiency) |
10 candlesticks testing period (HIGH efficiency) |
||||
|---|---|---|---|---|---|---|
| Symbol | Number of Occurrences |
Average Frequency |
Number of Occurrences |
% of Occurrences |
Number of Occurrences |
% of Occurrences |
| BSX | 36 | 139.8 | 16 | 44.44 % | 22 | 61.11 % |
| EL | 38 | 129.9 | 17 | 44.74 % | 23 | 60.52 % |
| RCL | 36 | 139.8 | 17 | 47.23 % | 21 | 58.33 % |
| AIG | 38 | 132.5 | 18 | 47.37 % | 21 | 57.90 % |
| ADI | 38 | 132.5 | 22 | 57.90 % | 22 | 57.90 % |
| ROP | 46 | 109.4 | 20 | 43.47 % | 26 | 56.52 % |
| FFIV | 34 | 118.9 | 19 | 55.88 % | 19 | 55.89 % |
| PLL | 33 | 152.5 | 12 | 36.37 % | 18 | 54.55 % |
| AA | 35 | 143.8 | 15 | 42.86 % | 19 | 54.28 % |
| BRCM | 26 | 166.5 | 13 | 50.01 % | 14 | 53.85 % |
| Occurrences Statistics | 5 candlesticks testing period (FALSE efficiency) |
10 candlesticks testing period (FALSE efficiency) |
||||
|---|---|---|---|---|---|---|
| Symbol | Number of Occurrences |
Average Frequency |
Number of Occurrences |
% of Occurrences |
Number of Occurrences |
% of Occurrences |
| COL | 28 | 125.7 | 12 | 42.86 % | 12 | 42.86 % |
| NTAP | 32 | 154.2 | 13 | 40.62 % | 13 | 40.62 % |
| EBAY | 33 | 127.8 | 13 | 39.39 % | 13 | 39.39 % |
| JNPR | 32 | 125.9 | 12 | 37.50 % | 12 | 37.50 % |
| FISV | 35 | 143.8 | 13 | 37.14 % | 13 | 37.14 % |
| MU | 38 | 132.5 | 14 | 36.84 % | 14 | 36.84 % |
| A | 28 | 140.3 | 12 | 42.86 % | 10 | 35.71 % |
| GRMN | 26 | 140.8 | 9 | 34.62 % | 9 | 34.62 % |
| NVDA | 30 | 137.9 | 10 | 33.33 % | 10 | 33.33 % |
| REGN | 36 | 139.8 | 12 | 33.33 % | 12 | 33.33 % |
Scanner settings: daily stocks
Group: S&P500
Number of symbols: 502
Date range: 7/1/2010 - 6/30/2015
Time interval: daily candles
Total number of candlesticks: 614,034
Number of occurrences (Three Inside Down): 3,730
Number of occurrences (all candlestick patterns): 166,328
% of occurrences (Three Inside Down): 2.24 %
Average frequency: 164.6
Efficiency statistics (5 candlesticks testing period)
| Efficiency | NO DATA | FALSE | LOW | MEDIUM | HIGH |
|---|---|---|---|---|---|
| Number of Occurrences |
7 | 536 | 1,492 | 851 | 844 |
| % of Occurrences |
0.19 % | 14.18 % | 40.00 % | 22.82 % | 22.81 % |
| Efficiency | NO DATA | FALSE | LOW | MEDIUM | HIGH |
|---|---|---|---|---|---|
| Number of Occurrences |
27 | 480 | 1,216 | 764 | 1,243 |
| % of Occurrences |
0.72 % | 12.15 % | 32.60 % | 20.48 % | 34.05 % |
| Occurrences Statistics | 5 candlesticks testing period (HIGH efficiency) |
10 candlesticks testing period (HIGH efficiency) |
||||
|---|---|---|---|---|---|---|
| Symbol | Number of Occurrences |
Average Frequency |
Number of Occurrences |
% of Occurrences |
Number of Occurrences |
% of Occurrences |
| MUR | 8 | 157.3 | 4 | 50.00 % | 6 | 75.00 % |
| CHK | 7 | 179.7 | 4 | 57.14 % | 5 | 71.43 % |
| HAS | 7 | 179.7 | 2 | 28.57 % | 5 | 71.43 % |
| AAPL | 7 | 179.7 | 1 | 14.29 % | 5 | 71.42 % |
| ETFC | 7 | 179.7 | 5 | 71.42 % | 5 | 71.42 % |
| RIG | 7 | 179.7 | 5 | 71.42 % | 5 | 71.42 % |
| GLW | 9 | 139.8 | 3 | 33.34 % | 6 | 66.67 % |
| ICE | 9 | 139.8 | 4 | 44.45 % | 6 | 66.67 % |
| TRIP | 6 | 149.2 | 4 | 66.67 % | 4 | 66.67 % |
| DISCA | 6 | 209.7 | 4 | 66.66 % | 4 | 66.66 % |
| Occurrences Statistics | 5 candlesticks testing period (FALSE efficiency) |
10 candlesticks testing period (FALSE efficiency) |
||||
|---|---|---|---|---|---|---|
| Symbol | Number of Occurrences |
Average Frequency |
Number of Occurrences |
% of Occurrences |
Number of Occurrences |
% of Occurrences |
| SNDK | 6 | 209.7 | 4 | 66.67 % | 4 | 66.67 % |
| INTC | 7 | 179.7 | 4 | 57.14 % | 4 | 57.14 % |
| MU | 7 | 179.7 | 4 | 57.14 % | 4 | 57.14 % |
| REGN | 9 | 139.7 | 5 | 55.56 % | 5 | 55.56 % |
| CVC | 13 | 96.8 | 7 | 53.85 % | 7 | 53.85 % |
| A | 10 | 125.8 | 7 | 70.00 % | 5 | 50.00 % |
| COL | 6 | 209.7 | 3 | 50.00 % | 3 | 50.00 % |
| CVS | 6 | 209.7 | 3 | 50.00 % | 3 | 50.00 % |
| EIX | 6 | 209.7 | 4 | 66.67 % | 3 | 50.00 % |
| WMB | 8 | 157.3 | 4 | 50.00 % | 4 | 50.00 % |

