
See our Patterns Dictionary for other patterns.
Check our CandleScanner software and start trading candlestick patterns!

Figure 1. Three Black Crows pattern.
Japanese name: sanba garasu (by Morris)
Forecast: bearish reversal
Trend prior to the pattern: uptrend
Opposite pattern: Three White Soldiers
Construction:
- First candle
- a candle in an uptrend
- black body
- Second candle
- black body
- the opening price within the previous body
- the closing price below the previous closing price
- Third candle
- black body
- the opening price within the previous body
- the closing price below the previous closing price
The Three Black Crows is a three-line bearish reversal candlestick pattern.
The first line appears in an uptrend, and two other lines are opening below the prior candle's opening price but above the prior candle's closing price. It is allowed that the second or the third candle's opening price is equal to the previous candle's opening price.
Historically the pattern had more conditions, for example, that the following candle should open at least halfway down the previous candle. Another requirement in the past was that the candles should have a very short lower shadows. Nowadays such constraints are rejected by most of the traders. Three black candles appearing as long lines, each closing at a new low, indicate well the market sentiment.
The Three Black Crows is often forming a resistance zone. It happens, however, that three black candles are not breaking the nearest support zone and price moves sideways.
Often the pattern is preceded by reversal patterns, for example Bullish Engulfing, Evening Star, Northern Doji and others.
Location of the pattern on the chart may be essential. If the first line breaks a trendline, price declines can be deep. Especially when there are no significant support areas nearby.
The Three Black Crows pattern is canceled when it is followed by candles which closing price is above the first line opening price.

Figure 2. A Three Black Crows candlestick pattern appears in a strong uptrend. The first line of the pattern is the second line of a Bearish Engulfing.
A significant price decrease characterizes every appearance of the Three Black Crows pattern. In a bear market, the pattern is likely to be followed by additional declines. In a bull market, the bulls may be battling with the bears for a while.
The Three Black Crows is composed of three black candles, except the doji and the spinning tops. Additionally candles need to appear as long lines.
You can see that the stock moved sideways for around two weeks time before price continued moving down. In the case of this pattern price often moves sideways because it forms a resistance zone.
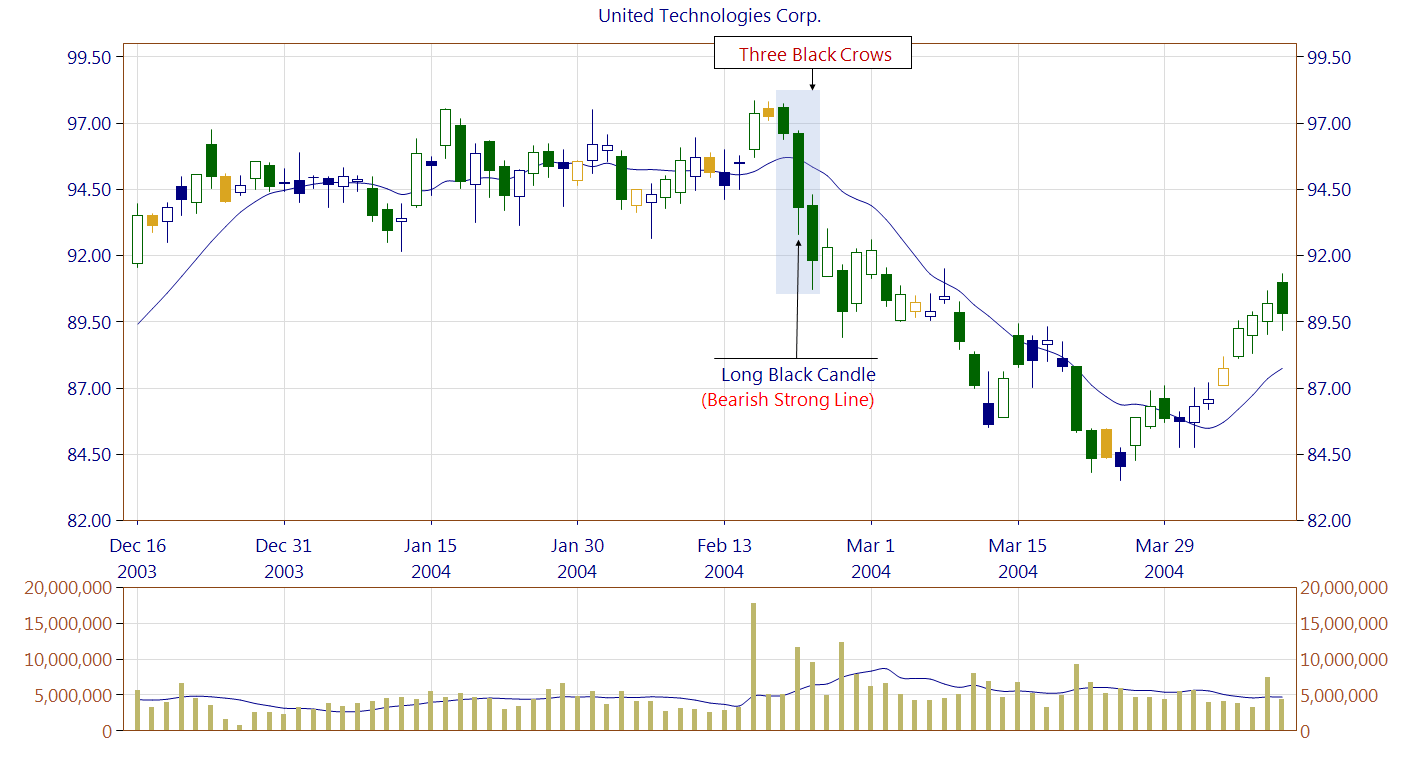
Figure 3. A Three Black Crows candle pattern is preceded by a price moving sideways. Its second line is classified as a Long Black Candle (basic candle), being at the same time considered as a Bearish Strong Line pattern. Additionally the candle is formed at a high trading volume and breaks the trendline which indicates its strong bearish sentiment.
The bulls tried to gain control but failed because were not able to close above the opening price of the third line.
Three Black Crows statistics
Below you can find some Three Black Crows pattern statistics calculated by CandleScanner software.
Scanner settings: daily stocks
Group: S&P500
Number of symbols: 502
Date range: 7/1/1995 - 6/30/2015
Time interval: daily candles
Total number of candlesticks: 2,236,421
Number of occurrences (Three Black Crows): 543
Number of occurrences (all candlestick patterns): 638,570
% of occurrences (Three Black Crows): 0.09 %
Average frequency: 4,118.6
Efficiency statistics (5 candlesticks testing period)
| Efficiency | NO DATA | FALSE | LOW | MEDIUM | HIGH |
|---|---|---|---|---|---|
| Number of Occurrences |
2 | 103 | 165 | 99 | 174 |
| % of Occurrences |
0.37 % | 18.60 % | 30.39 % | 18.23 % | 32.41 % |
| Efficiency | NO DATA | FALSE | LOW | MEDIUM | HIGH |
|---|---|---|---|---|---|
| Number of Occurrences |
3 | 97 | 145 | 88 | 210 |
| % of Occurrences |
0.55 % | 17.31 % | 26.70 % | 16.21 % | 39.23 % |
| Occurrences Statistics | 5 candlesticks testing period (HIGH efficiency) |
10 candlesticks testing period (HIGH efficiency) |
||||
|---|---|---|---|---|---|---|
| Symbol | Number of Occurrences |
Average Frequency |
Number of Occurrences |
% of Occurrences |
Number of Occurrences |
% of Occurrences |
| CSCO | 4 | 1,258.5 | 4 | 100.00 % | 3 | 75.00 % |
| SBUX | 3 | 1,678.0 | 2 | 66.67 % | 3 | 100.00 % |
| AIV | 4 | 1,258.5 | 1 | 25.00 % | 3 | 75.00 % |
| CTXS | 4 | 1,230.8 | 3 | 75.00 % | 3 | 75.00 % |
| RCL | 4 | 1,258.5 | 3 | 75.00 % | 3 | 75.00 % |
| AMGN | 3 | 1,678.0 | 1 | 33.34 % | 1 | 33.34 % |
| BEN | 3 | 1,678.0 | 2 | 66.67 % | 2 | 66.67 % |
| CNX | 3 | 1,356.3 | 2 | 66.67 % | 2 | 66.67 % |
| CSC | 3 | 1,678.0 | 2 | 66.67 % | 2 | 66.67 % |
| ESV | 3 | 1,678.0 | 2 | 66.67 % | 2 | 66.67 % |
| Occurrences Statistics | 5 candlesticks testing period (FALSE efficiency) |
10 candlesticks testing period (FALSE efficiency) |
||||
|---|---|---|---|---|---|---|
| Symbol | Number of Occurrences |
Average Frequency |
Number of Occurrences |
% of Occurrences |
Number of Occurrences |
% of Occurrences |
| BRK.B | 3 | 1,606.0 | 2 | 66.67 % | 2 | 66.67 % |
| GPC | 3 | 1,678.0 | 2 | 66.67 % | 2 | 66.67 % |
| REGN | 3 | 1,677.7 | 2 | 66.67 % | 2 | 66.67 % |
| VRTX | 3 | 1,677.3 | 2 | 66.67 % | 2 | 66.67 % |
| NVDA | 5 | 827.2 | 3 | 60.00 % | 3 | 60.00 % |
| SYMC | 4 | 1,258.5 | 2 | 50.00 % | 2 | 50.00 % |
| UA | 4 | 604.5 | 2 | 50.00 % | 2 | 50.00 % |
| BA | 3 | 1,678.0 | 1 | 33.33 % | 1 | 33.33 % |
| BEN | 3 | 1,678.0 | 1 | 33.33 % | 1 | 33.33 % |
| CAH | 6 | 839.0 | 2 | 33.33 % | 2 | 33.33 % |
Scanner settings: daily stocks
Group: S&P500
Number of symbols: 502
Date range: 7/1/2010 - 6/30/2015
Time interval: daily candles
Total number of candlesticks: 614,034
Number of occurrences (Three Black Crows): 112
Number of occurrences (all candlestick patterns): 166,328
% of occurrences (Three Black Crows): 0.07 %
Average frequency: 5,482.4
Efficiency statistics (5 candlesticks testing period)
| Efficiency | NO DATA | FALSE | LOW | MEDIUM | HIGH |
|---|---|---|---|---|---|
| Number of Occurrences |
2 | 15 | 41 | 25 | 29 |
| % of Occurrences |
1.79 % | 11.60 % | 36.61 % | 22.32 % | 27.68 % |
| Efficiency | NO DATA | FALSE | LOW | MEDIUM | HIGH |
|---|---|---|---|---|---|
| Number of Occurrences |
3 | 13 | 37 | 20 | 39 |
| % of Occurrences |
2.68 % | 8.93 % | 33.04 % | 17.86 % | 37.49 % |
| Occurrences Statistics | 5 candlesticks testing period (HIGH efficiency) |
10 candlesticks testing period (HIGH efficiency) |
||||
|---|---|---|---|---|---|---|
| Symbol | Number of Occurrences |
Average Frequency |
Number of Occurrences |
% of Occurrences |
Number of Occurrences |
% of Occurrences |
| CSCO | 2 | 629.0 | 2 | 100.00 % | 1 | 50.00 % |
| KMI | 2 | 551.0 | 1 | 50.00 % | 2 | 100.00 % |
| BAC | 2 | 629.0 | 0 | 0.00 % | 1 | 50.00 % |
| HOT | 2 | 629.0 | 0 | 0.00 % | 1 | 50.00 % |
| PCP | 2 | 629.0 | 0 | 0.00 % | 1 | 50.00 % |
| WMB | 2 | 629.0 | 1 | 50.00 % | 1 | 50.00 % |
| NVDA | 3 | 419.3 | 1 | 33.34 % | 1 | 33.34 % |
| Occurrences Statistics | 5 candlesticks testing period (FALSE efficiency) |
10 candlesticks testing period (FALSE efficiency) |
||||
|---|---|---|---|---|---|---|
| Symbol | Number of Occurrences |
Average Frequency |
Number of Occurrences |
% of Occurrences |
Number of Occurrences |
% of Occurrences |
| NVDA | 3 | 419.3 | 1 | 33.33 % | 1 | 33.33 % |

