
See our Patterns Dictionary for other patterns.
Check our CandleScanner software and start trading candlestick patterns!
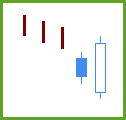
Figure 1. Bullish Engulfing pattern.
Japanese name: tsutsumi
Forecast: bullish reversal
Trend prior to the pattern: downtrend
Opposite pattern: Bearish Engulfing
Extended pattern: Three Outside Up
See also: Last Engulfing Top
Construction:
- First candle
- a candle in a downtrend
- black body
- Second candle
- white body
- candle's body engulfs the prior (black) candle's body
The shadow's length does not matter, neither on the first nor the second line.
The pattern appears in a downtrend and forecasts its reversal. If the trading volume data is available for a given market and it grows on the second line, the pattern reliability is higher. The Bullish Engulfing pattern needs confirmation on the subsequent candles.
Morris created the Three Outside Up pattern as a confirmation of the Bullish Engulfing. In general, every pattern is recommended to be confirmed. Confirmation can be in the form of breaking the nearest resistance zone or a trendline.
It is crucial where, on the chart, a Bullish Engulfing appears. Depending on the market context, the candle pattern may be only a short break before further market decreases. Especially if, above a Bullish Engulfing, a strong resistance area exists.
If a Bullish Engulfing pattern is confirmed, its second line may form a support zone.

Figure 2. The chart presents an interesting example of a Bullish Engulfing pattern occurrence. It demonstrates why every pattern appearance should be analysed in broader market context, which in the case of daily charts can span even weeks. Prior to the Bullish Engulfing occurrence, a very strong resistance zone is built by occurrences of Falling Window, Long Black Candle (1), and Black Candle. Then the Bullish Engulfing pattern is formed. If not looking at what happens later in the future, we have to say that such pattern reliability is rather weak. For instance, its second line being the White Candle is not impressive in the context of previously formed black candles, especially the Long Black Candle (1). Also, the trading volume on the pattern occurrence is lower than the average. Surprisingly, the next day after the pattern occurrence, price gaps and forms another white candle. It breaks the trendline and creates the Three Outside Up bullish pattern. Then shortly the Long Black Candle (2) appears, and the volume increases what should be seen as a warning that the bears are sound. The mentioned resistance zone is still valid and solid, although it was created three weeks earlier. Nevertheless, the market tries to move up until the Long Black Candle (3) stops the bulls.

Figure 3. A Bearish Engulfing pattern, containing a Bearish Belt Hold one-line pattern as its second line, is confirmed by the Three Outside Down. A Long Black Candle cancels a Long White Candle, which creates a support zone prior the Bearish Engulfing pattern. The pattern, along with the Long Black Candle, forms a resistance region. Then a Bullish Engulfing pattern appears, but the following black candle closing below the trendline cannot be considered as a confirmation of the pattern. The market still tries to move up, and yet another Bullish Engulfing pattern is developed. Its weakness is, however, a small volume, which indicates the lack of faith on the bulls’ side to break the resistance area. A day after the pattern completes, price gaps upward, but the market eventually drops, showing its weakness. The appearance of a Black Candle cancels both occurrences of the Bullish Engulfing pattern.
Bullish Engulfing statistics
Below you can find some Bullish Engulfing pattern statistics calculated by CandleScanner software. To see more detailed statistics, for other markets and periodicity try our CandleScanner software. Prices start at only $10, and you can see more detailed statistics, for other markets and periodicity. Click here to find out more!
Scanner settings: daily stocks
Group: S&P500
Number of symbols: 502
Date range: 7/1/1995 - 6/30/2015
Time interval: daily candles
Total number of candlesticks: 2,236,421
Number of occurrences (Bullish Engulfing): 27,081
Number of occurrences (all candlestick patterns): 638,570
% of occurrences (Bullish Engulfing): 4.24 %
Average frequency: 82.6
Efficiency statistics (5 candlesticks testing period)
| Efficiency | NO DATA | FALSE | LOW | MEDIUM | HIGH |
|---|---|---|---|---|---|
| Number of Occurrences |
13 | 4,920 | 7,459 | 5,248 | 9,441 |
| % of Occurrences |
0.05 % | 18.12 % | 27.54 % | 19.38 % | 34.91 % |
| Efficiency | NO DATA | FALSE | LOW | MEDIUM | HIGH |
|---|---|---|---|---|---|
| Number of Occurrences |
21 | 4,639 | 5,902 | 4,464 | 12,055 |
| % of Occurrences |
0.08 % | 17.05 % | 21.79 % | 16.48 % | 44.60 % |
| Occurrences Statistics | 5 candlesticks testing period (HIGH efficiency) |
10 candlesticks testing period (HIGH efficiency) |
||||
|---|---|---|---|---|---|---|
| Symbol | Number of Occurrences |
Average Frequency |
Number of Occurrences |
% of Occurrences |
Number of Occurrences |
% of Occurrences |
| VLO | 63 | 79.9 | 36 | 57.15 % | 43 | 68.25 % |
| ROST | 69 | 73.0 | 36 | 52.18 % | 42 | 60.88 % |
| COG | 68 | 74.0 | 38 | 55.88 % | 41 | 60.30 % |
| FAST | 77 | 65.4 | 38 | 49.35 % | 46 | 59.74 % |
| HES | 59 | 85.3 | 31 | 52.55 % | 35 | 59.33 % |
| WDC | 68 | 74.0 | 35 | 51.47 % | 40 | 58.83 % |
| AMAT | 60 | 83.9 | 30 | 50.00 % | 35 | 58.33 % |
| RHT | 62 | 64.5 | 32 | 51.62 % | 36 | 58.07 % |
| ADSK | 64 | 78.7 | 35 | 54.69 % | 37 | 57.82 % |
| CERN | 75 | 67.1 | 33 | 44.00 % | 42 | 56.00 % |
| Occurrences Statistics | 5 candlesticks testing period (FALSE efficiency) |
10 candlesticks testing period (FALSE efficiency) |
||||
|---|---|---|---|---|---|---|
| Symbol | Number of Occurrences |
Average Frequency |
Number of Occurrences |
% of Occurrences |
Number of Occurrences |
% of Occurrences |
| REGN | 79 | 63.7 | 34 | 43.04 % | 34 | 43.04 % |
| KMX | 59 | 78.5 | 24 | 40.68 % | 24 | 40.68 % |
| FLIR | 61 | 82.5 | 22 | 36.07 % | 22 | 36.07 % |
| SWKS | 61 | 82.5 | 22 | 36.07 % | 22 | 36.07 % |
| EA | 63 | 79.9 | 21 | 33.33 % | 21 | 33.33 % |
| AMZN | 61 | 74.8 | 19 | 31.15 % | 19 | 31.15 % |
| CELG | 69 | 73.0 | 21 | 30.43 % | 21 | 30.43 % |
| ESV | 60 | 83.9 | 18 | 28.33 % | 18 | 28.33 % |
| GT | 65 | 77.4 | 19 | 29.23 % | 19 | 29.23 % |
| INTC | 62 | 81.2 | 20 | 32.26 % | 18 | 29.03 % |
Scanner settings: daily stocks
Group: S&P500
Number of symbols: 502
Date range: 7/1/2010 - 6/30/2015
Time interval: daily candles
Total number of candlesticks: 614,034
Number of occurrences (Bullish Engulfing): 5,953
Number of occurrences (all candlestick patterns): 166,328
% of occurrences (Bullish Engulfing): 3.58 %
Average frequency: 103.1
Efficiency statistics (5 candlesticks testing period)
| Efficiency | NO DATA | FALSE | LOW | MEDIUM | HIGH |
|---|---|---|---|---|---|
| Number of Occurrences |
13 | 699 | 2,014 | 1,405 | 1,822 |
| % of Occurrences |
0.22 % | 11.52 % | 33.83 % | 23.60 % | 30.83 % |
| Efficiency | NO DATA | FALSE | LOW | MEDIUM | HIGH |
|---|---|---|---|---|---|
| Number of Occurrences |
21 | 612 | 1,503 | 1,182 | 2,635 |
| % of Occurrences |
0.35 % | 9.93 % | 25.25 % | 19.86 % | 44.61 % |
| Occurrences Statistics | 5 candlesticks testing period (HIGH efficiency) |
10 candlesticks testing period (HIGH efficiency) |
||||
|---|---|---|---|---|---|---|
| Symbol | Number of Occurrences |
Average Frequency |
Number of Occurrences |
% of Occurrences |
Number of Occurrences |
% of Occurrences |
| HSP | 15 | 83.9 | 8 | 53.33 % | 13 | 86.67 % |
| VLO | 15 | 83.9 | 12 | 80.00 % | 13 | 86.67 % |
| PSX | 12 | 67.4 | 9 | 75.00 % | 10 | 83.33 % |
| CI | 13 | 96.8 | 8 | 61.54 % | 10 | 76.93 % |
| ENDP | 13 | 96.8 | 9 | 69.23 % | 10 | 76.93 % |
| HES | 13 | 96.8 | 9 | 69.23 % | 10 | 76.93 % |
| ICE | 13 | 96.8 | 8 | 61.54 % | 10 | 76.93 % |
| TSCO | 13 | 96.8 | 8 | 61.54 % | 10 | 76.93 % |
| KSU | 12 | 104.8 | 6 | 50.00 % | 9 | 75.00 % |
| ALXN | 15 | 83.9 | 9 | 60.00 % | 11 | 73.34 % |
| Occurrences Statistics | 5 candlesticks testing period (FALSE efficiency) |
10 candlesticks testing period (FALSE efficiency) |
||||
|---|---|---|---|---|---|---|
| Symbol | Number of Occurrences |
Average Frequency |
Number of Occurrences |
% of Occurrences |
Number of Occurrences |
% of Occurrences |
| AVGO | 12 | 104.8 | 5 | 41.67 % | 5 | 41.67 % |
| VMC | 15 | 83.9 | 6 | 40.00 % | 6 | 40.00 % |
| REGN | 13 | 96.7 | 5 | 38.46 % | 5 | 38.46 % |
| DOV | 12 | 104.8 | 4 | 33.33 % | 4 | 33.33 % |
| MUR | 12 | 104.8 | 4 | 33.33 % | 4 | 33.33 % |
| SNI | 12 | 104.8 | 4 | 33.33 % | 4 | 33.33 % |
| GT | 13 | 96.8 | 4 | 30.77 % | 4 | 30.77 % |
| RRC | 13 | 96.8 | 4 | 30.77 % | 4 | 30.77 % |
| LEN | 21 | 59.9 | 6 | 28.57 % | 6 | 28.57 % |
| IBM | 15 | 83.9 | 5 | 33.33 % | 4 | 26.67 % |


1 Response