
See our Patterns Dictionary for other patterns.
Check our CandleScanner software and start trading candlestick patterns!
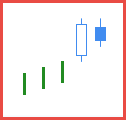
Figure 1. Tweezers Top pattern.
Japanese name: kenukitenjo
Forecast: bearish reversal
Trend prior to the pattern: uptrend
Number of candle lines: 2, 3, 4 or more
Opposite pattern: Tweezers Bottom
Construction:
- First candle
- a candle in an uptrend
- any color
- any candle except the Four-Price Doji
- Second candle
- any candle except the Four-Price Doji
- any color
- the high price equal to the previous high price
- Every subsequent day
- any candle except the Four-Price Doji
- any color
- the high price equal to the previous high price
The first line can be any candle in an uptrend of any color except the Four-Price Doji. The subsequent candles may be of any color and type, except the Four-Price Doji, but all high prices need to be equal.
The Tweezers Top may be a part of other patterns in an uptrend. It has to be confirmed on the following candles.

Figure 2. The Tweezers Top (similarly as the Tweezers Bottom) is distinguished by having two or more candle lines. The only requirement is that all candles share the same high price. The market context is the most important factor when it comes to the pattern reliability.
On the chart, a Tweezers Top is composed of three lines. The third line of the pattern forms a Hanging Man pattern. On top of that the Hanging Man is the first line of a Bearish Engulfing pattern. Shortly the bears push the price much lower, and an Opening Black Marubozu basic candle is formed.
It is worth to mention that the Bearish Engulfing pattern is hardly visible on the chart. Such situations happen quite often when looking at the candlestick charts. Depending on the given chart using different scale/zoom we can interpret the chart differently. In the case of the Bearish Engulfing, the second line is a long line. However looking with the naked eye most probably we would consider that Black Candle as a short candle. Using specialized software like CandleScanner helps to be more objective when assessing the market.

Figure 3. The occurrence of Tweezers Top is followed by a Rising Window, which indicates that the bulls are still in control of the stock. The price gap formed by the Rising Window is shallow -- barely 2 cents. Nevertheless, it cancels the Tweezers Top appearance.
Tweezers Top statistics
Below you can find some Tweezers Top pattern statistics calculated by CandleScanner software. To see more detailed statistics, for other markets and periodicity try our CandleScanner software. Prices start at only $10, and you can see more detailed statistics, for other markets and periodicity. Click here to find out more!
Scanner settings: daily stocks
Group: S&P500
Number of symbols: 502
Date range: 7/1/1995 - 6/30/2015
Time interval: daily candles
Total number of candlesticks: 2,236,421
Number of occurrences (Tweezers Top): 24,629
Number of occurrences (all candlestick patterns): 638,570
% of occurrences (Tweezers Top): 3.86 %
Average frequency: 90.8
Efficiency statistics (5 candlesticks testing period)
| Efficiency | NO DATA | FALSE | LOW | MEDIUM | HIGH |
|---|---|---|---|---|---|
| Number of Occurrences |
7 | 4,296 | 8,643 | 4,831 | 6,852 |
| % of Occurrences |
0.03 % | 17.41 % | 35.09 % | 19.62 % | 27.85 % |
| Efficiency | NO DATA | FALSE | LOW | MEDIUM | HIGH |
|---|---|---|---|---|---|
| Number of Occurrences |
18 | 4,021 | 7,022 | 4,429 | 9,139 |
| % of Occurrences |
0.07 % | 16.26 % | 28.51 % | 17.98 % | 37.18 % |
| Occurrences Statistics | 5 candlesticks testing period (HIGH efficiency) |
10 candlesticks testing period (HIGH efficiency) |
||||
|---|---|---|---|---|---|---|
| Symbol | Number of Occurrences |
Average Frequency |
Number of Occurrences |
% of Occurrences |
Number of Occurrences |
% of Occurrences |
| DVN | 50 | 100.7 | 25 | 50.00 % | 34 | 68.00 % |
| PWR | 46 | 95.1 | 25 | 54.34 % | 30 | 65.21 % |
| TROW | 46 | 109.4 | 20 | 45.65 % | 26 | 58.69 % |
| BHI | 47 | 107.1 | 23 | 48.94 % | 27 | 57.44 % |
| REGN | 70 | 71.9 | 40 | 57.14 % | 40 | 57.14 % |
| KMX | 52 | 89.1 | 26 | 50.00 % | 29 | 55.77 % |
| TMO | 56 | 89.9 | 22 | 39.29 % | 31 | 55.36 % |
| PCAR | 51 | 98.7 | 21 | 41.17 % | 28 | 54.90 % |
| AAPL | 105 | 47.9 | 53 | 50.48 % | 57 | 54.29 % |
| NBL | 58 | 86.8 | 24 | 41.38 % | 31 | 53.46 % |
| Occurrences Statistics | 5 candlesticks testing period (FALSE efficiency) |
10 candlesticks testing period (FALSE efficiency) |
||||
|---|---|---|---|---|---|---|
| Symbol | Number of Occurrences |
Average Frequency |
Number of Occurrences |
% of Occurrences |
Number of Occurrences |
% of Occurrences |
| CELG | 105 | 47.9 | 47 | 44.76 % | 47 | 44.76 % |
| HUM | 51 | 98.7 | 21 | 41.18 % | 21 | 41.18 % |
| MNST | 109 | 40.1 | 44 | 40.37 % | 44 | 40.37 % |
| LVLT | 48 | 90.4 | 19 | 39.58 % | 19 | 39.58 % |
| VRTX | 51 | 98.7 | 19 | 37.25 % | 19 | 37.25 % |
| MHK | 53 | 95.0 | 20 | 37.74 % | 19 | 35.85 % |
| LH | 83 | 60.7 | 29 | 34.94 % | 29 | 34.94 % |
| PXD | 57 | 88.3 | 19 | 33.33 % | 19 | 33.33 % |
| GMCR | 134 | 37.2 | 43 | 32.09 % | 43 | 32.09 % |
| ESV | 52 | 96.8 | 16 | 30.77 % | 16 | 30.77 % |
Scanner settings: daily stocks
Group: S&P500
Number of symbols: 502
Date range: 7/1/2010 - 6/30/2015
Time interval: daily candles
Total number of candlesticks: 614,034
Number of occurrences (Tweezers Top): 3,209
Number of occurrences (all candlestick patterns): 166,328
% of occurrences (Tweezers Top): 1.93 %
Average frequency: 191.3
Efficiency statistics (5 candlesticks testing period)
| Efficiency | NO DATA | FALSE | LOW | MEDIUM | HIGH |
|---|---|---|---|---|---|
| Number of Occurrences |
7 | 437 | 1,440 | 687 | 638 |
| % of Occurrences |
0.22 % | 13.40 % | 44.87 % | 21.41 % | 20.10 % |
| Efficiency | NO DATA | FALSE | LOW | MEDIUM | HIGH |
|---|---|---|---|---|---|
| Number of Occurrences |
18 | 376 | 1,171 | 672 | 972 |
| % of Occurrences |
0.56 % | 11.16 % | 36.49 % | 20.94 % | 30.85 % |
| Occurrences Statistics | 5 candlesticks testing period (HIGH efficiency) |
10 candlesticks testing period (HIGH efficiency) |
||||
|---|---|---|---|---|---|---|
| Symbol | Number of Occurrences |
Average Frequency |
Number of Occurrences |
% of Occurrences |
Number of Occurrences |
% of Occurrences |
| CME | 9 | 139.8 | 3 | 33.34 % | 8 | 88.89 % |
| EA | 6 | 209.7 | 4 | 66.67 % | 5 | 83.33 % |
| COH | 5 | 251.6 | 3 | 60.00 % | 4 | 80.00 % |
| GPS | 5 | 251.6 | 4 | 80.00 % | 4 | 80.00 % |
| UA | 9 | 139.8 | 6 | 66.67 % | 6 | 77.78 % |
| GNW | 12 | 104.8 | 7 | 58.34 % | 8 | 75.00 % |
| PWR | 8 | 157.3 | 5 | 62.50 % | 6 | 75.00 % |
| MU | 7 | 179.7 | 4 | 57.14 % | 5 | 71.42 % |
| SPLS | 10 | 125.8 | 6 | 60.00 % | 7 | 70.00 % |
| NDAQ | 6 | 209.7 | 2 | 33.34 % | 4 | 66.67 % |
| Occurrences Statistics | 5 candlesticks testing period (FALSE efficiency) |
10 candlesticks testing period (FALSE efficiency) |
||||
|---|---|---|---|---|---|---|
| Symbol | Number of Occurrences |
Average Frequency |
Number of Occurrences |
% of Occurrences |
Number of Occurrences |
% of Occurrences |
| CI | 7 | 179.7 | 3 | 42.86 % | 3 | 42.86 % |
| MA | 7 | 179.7 | 3 | 42.86 % | 3 | 42.86 % |
| VLO | 7 | 179.7 | 3 | 42.86 % | 3 | 42.86 % |
| CVX | 5 | 251.6 | 2 | 40.00 % | 2 | 40.00 % |
| DRI | 10 | 125.8 | 4 | 40.00 % | 4 | 40.00 % |
| SNI | 5 | 251.6 | 2 | 40.00 % | 2 | 40.00 % |
| LVLT | 13 | 96.8 | 5 | 38.46 % | 5 | 38.46 % |
| BAX | 8 | 157.3 | 3 | 37.50 % | 3 | 37.50 % |
| DD | 8 | 157.3 | 3 | 37.50 % | 3 | 37.50 % |
| OMC | 8 | 157.3 | 3 | 37.50 % | 3 | 37.50 % |

