
See our Patterns Dictionary for other patterns.
Check our CandleScanner software and start trading candlestick patterns!
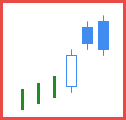
Figure 1. Upside Gap Two Crows pattern.
Japanese name: shita banare niwa garasu
Forecast: bearish reversal
Trend prior to the pattern: uptrend
Opposite pattern: none
See Also: Two Crows
Construction:
- First candle
- a candle in an uptrend
- white body
- Second candle
- black body
- candle's body above the previous candle's body
- Third candle
- black body
- candle’s body engulfs the prior candle’s body
The Upside Gap Two Crows is a three-line bearish reversal pattern appearing in an uptrend. The pattern name may suggest that is composed of two candles, whereas in fact it is formed by three lines.
The first line is formed by a candle appearing as a long line, having white body. It can be one of the following basic candles: White Candle, Long White Candle, White Marubozu, Opening White Marubozu, Closing White Marubozu.
The second line may be any black candle except doji, which body is located above the previous candle's body. In other words, the candle needs to close above the prior closing.
The third line is also formed by a black candle. Its body engulfs the prior candle's body. Additionally the candle's closing price is above the first line's closing price, what forms a gap.
The pattern has to be confirmed on the following candles. Note that the first line of the pattern forms a support zone, which has to be broken. If the pattern is not confirmed it may happen to be only a short pause in an uptrend.
The Upside Gap Two Crows appears very rarely on the candlestick charts.

Figure 2. The strength of the Upside Gap Two Crows, by definition, is in its third line. However, its first line forms a support zone, which cannot be ignored.
On the chart, an Upside Gap Two Crows occurrence contains a Bullish Strong Line pattern which forms a strong support zone enforced by an increased trading volume. In other words, an existence of the Bullish Strong Line in such place indicates that the bulls control the stock.
In such market context, the Upside Gap Two Crows in order to be confirmed, needs to be followed by a candle closing below the first line (Bullish Strong Line).
Indeed, the Bullish Strong Line acted as a support zone for 5 days until a Black Candle appeared, confirming the Upside Gap Two Crows finally.

Figure 3. In the Figure 2 we show an example of an Upside Gap Two Crows which is confirmed, and the market falls.
Figure 3 is similar. However, the bulls cannot move the market below a White Candle, being the first line of an Upside Gap Two Crows occurrence. An Opening White Marubozu cancels the Upside Gap Two Crows eventually.
Upside Gap Two Crows statistics
Below you can find some Upside Gap Two Crows pattern statistics calculated by CandleScanner software.
Scanner settings: daily stocks
Group: S&P500
Number of symbols: 502
Date range: 7/1/1995 - 6/30/2015
Time interval: daily candles
Total number of candlesticks: 2,236,421
Number of occurrences (Upside Gap Two Crows): 150
Number of occurrences (all candlestick patterns): 638,570
% of occurrences (Upside Gap Two Crows): 0.02 %
Average frequency: 14,909.5
Efficiency statistics (5 candlesticks testing period)
| Efficiency | NO DATA | FALSE | LOW | MEDIUM | HIGH |
|---|---|---|---|---|---|
| Number of Occurrences |
0 | 25 | 55 | 31 | 39 |
| % of Occurrences |
0.00 % | 16.67 % | 36.67 % | 20.67 % | 25.99 % |
| Efficiency | NO DATA | FALSE | LOW | MEDIUM | HIGH |
|---|---|---|---|---|---|
| Number of Occurrences |
0 | 24 | 42 | 30 | 54 |
| % of Occurrences |
0.00 % | 16.00 % | 28.00 % | 20.00 % | 36.00 % |
| Occurrences Statistics | 5 candlesticks testing period (HIGH efficiency) |
10 candlesticks testing period (HIGH efficiency) |
||||
|---|---|---|---|---|---|---|
| Symbol | Number of Occurrences |
Average Frequency |
Number of Occurrences |
% of Occurrences |
Number of Occurrences |
% of Occurrences |
| BK | 2 | 2,517.0 | 1 | 50.00 % | 2 | 100.00 % |
| C | 2 | 2,517.0 | 2 | 100.00 % | 2 | 100.00 % |
| DFS | 1 | 2,026.0 | 1 | 100.00 % | 1 | 100.00 % |
| PNR | 2 | 2,517.0 | 0 | 0.00 % | 2 | 100.00 % |
| RHT | 1 | 3,997.0 | 1 | 100.00 % | 1 | 100.00 % |
| AAPL | 2 | 2,517.0 | 1 | 50.00 % | 1 | 50.00 % |
| APC | 2 | 2,517.0 | 1 | 50.00 % | 1 | 50.00 % |
| BWA | 2 | 2,517.0 | 1 | 50.00 % | 1 | 50.00 % |
| CL | 2 | 2,517.0 | 1 | 50.00 % | 1 | 50.00 % |
| HP | 2 | 2,517.0 | 1 | 50.00 % | 1 | 50.00 % |
| Occurrences Statistics | 5 candlesticks testing period (FALSE efficiency) |
10 candlesticks testing period (FALSE efficiency) |
||||
|---|---|---|---|---|---|---|
| Symbol | Number of Occurrences |
Average Frequency |
Number of Occurrences |
% of Occurrences |
Number of Occurrences |
% of Occurrences |
| AMP | 1 | 2,452.0 | 1 | 100.00 % | 1 | 100.00 % |
| CF | 1 | 2,488.0 | 1 | 100.00 % | 1 | 100.00 % |
| COL | 1 | 3,520.0 | 1 | 100.00 % | 1 | 100.00 % |
| NVDA | 1 | 4,136.0 | 1 | 100.00 % | 1 | 100.00 % |
| SE | 1 | 2,138.0 | 1 | 100.00 % | 1 | 100.00 % |
| CA | 2 | 2,517.0 | 1 | 50.00 % | 1 | 50.00 % |
| CSCO | 2 | 2,517.0 | 1 | 50.00 % | 1 | 50.00 % |
| FE | 2 | 2,517.0 | 1 | 50.00 % | 1 | 50.00 % |
| HRS | 2 | 2,517.0 | 1 | 50.00 % | 1 | 50.00 % |
| VLO | 2 | 2,517.0 | 1 | 50.00 % | 1 | 50.00 % |
Scanner settings: daily stocks
Group: S&P500
Number of symbols: 502
Date range: 7/1/2010 - 6/30/2015
Time interval: daily candles
Total number of candlesticks: 614,034
Number of occurrences (Upside Gap Two Crows): 55
Number of occurrences (all candlestick patterns): 166,328
% of occurrences (Upside Gap Two Crows): 0.03 %
Average frequency: 11,164.3
Efficiency statistics (5 candlesticks testing period)
| Efficiency | NO DATA | FALSE | LOW | MEDIUM | HIGH |
|---|---|---|---|---|---|
| Number of Occurrences |
0 | 5 | 27 | 13 | 10 |
| % of Occurrences |
0.00 % | 9.09 % | 49.09 % | 23.64 % | 18.18 % |
| Efficiency | NO DATA | FALSE | LOW | MEDIUM | HIGH |
|---|---|---|---|---|---|
| Number of Occurrences |
0 | 4 | 24 | 11 | 16 |
| % of Occurrences |
0.00 % | 7.27 % | 43.64 % | 20.00 % | 29.09 % |
| Occurrences Statistics | 5 candlesticks testing period (HIGH efficiency) |
10 candlesticks testing period (HIGH efficiency) |
||||
|---|---|---|---|---|---|---|
| Symbol | Number of Occurrences |
Average Frequency |
Number of Occurrences |
% of Occurrences |
Number of Occurrences |
% of Occurrences |
| AAPL | 1 | 1,258.0 | 1 | 100.00 % | 1 | 100.00 % |
| APD | 1 | 1,258.0 | 0 | 0.00 % | 1 | 100.00 % |
| BBY | 1 | 1,258.0 | 1 | 100.00 % | 1 | 100.00 % |
| BWA | 1 | 1,258.0 | 1 | 100.00 % | 1 | 100.00 % |
| DFS | 1 | 1,258.0 | 1 | 100.00 % | 1 | 100.00 % |
| DHR | 1 | 1,258.0 | 0 | 0.00 % | 1 | 100.00 % |
| ETN | 1 | 1,258.0 | 1 | 100.00 % | 1 | 100.00 % |
| GD | 1 | 1,258.0 | 0 | 0.00 % | 1 | 100.00 % |
| HUM | 1 | 1,258.0 | 1 | 100.00 % | 1 | 100.00 % |
| LEN | 1 | 1,258.0 | 0 | 0.00 % | 1 | 100.00 % |
| Occurrences Statistics | 5 candlesticks testing period (FALSE efficiency) |
10 candlesticks testing period (FALSE efficiency) |
||||
|---|---|---|---|---|---|---|
| Symbol | Number of Occurrences |
Average Frequency |
Number of Occurrences |
% of Occurrences |
Number of Occurrences |
% of Occurrences |
| CF | 1 | 1,258.0 | 1 | 100.00 % | 1 | 100.00 % |
| HRS | 1 | 1,258.0 | 1 | 100.00 % | 1 | 100.00 % |
| KIM | 1 | 1,258.0 | 1 | 100.00 % | 1 | 100.00 % |
| PCG | 1 | 1,258.0 | 1 | 100.00 % | 1 | 100.00 % |

