
See our Patterns Dictionary for other patterns.
Check our CandleScanner software and start trading candlestick patterns!
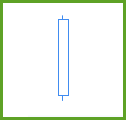
Figure 1. Bullish Strong Line pattern.
Forecast: bullish reversal / bullish continuation
Trend prior to the pattern: downtrend/uptrend
Opposite pattern: Bearish Strong Line
Construction:
- white body
- upper and lower shadow is not required
- none of the shadows can be larger than the body
- the candlestick body three times higher than the average body of the last 5 or 10 candles
- appears on as a long line
The Bullish Strong Line is a one-line pattern that can be classified as a bullish reversal or bullish continuation, depending on the market context in which it has been formed. If the whole body is placed above the trendline, we are dealing with a bullish continuation variant. When the opening price is below the trendline we have a bullish reversal pattern.
The pattern may be formed by the following basic candles: Long White Candle, White Marubozu, Opening White Marubozu or Closing White Marubozu. What is crucial is that the candlestick body needs to be at least three times higher than the average body of the last 5 or 10 candles.
Some other authors, for example Bulkowski, are describing the pattern called Long White Day. In our approach, what they treat as a Long White Day, we call Long White Candle, and it is a basic candle. We introduce the Bullish Strong Line pattern, because apart from the case where the candle contains both shadows (Long White Candle), we also allow marubozu candles. It makes sense, because why to exclude perfectly strong white candle only because one or two shadows do not exist?
The Bullish Strong Line forms a support zone, which is stronger when the candle appeared at a higher trading volume.
It may happen that at the same time the pattern may be considered as the Bullish Belt Hold pattern. Such occurrence of Bullish Belt Hold should be seen as very bullish because we deal with a candle body being at least three times higher than the average body of the last 5 or 10 candles.
The Bullish Strong Line may also appear within other patterns, for example as the first line of the Dark Cloud Cover and Bearish Harami, or as the second line of the Bullish Engulfing and Piercing.
There are even more patterns in which the Bullish Strong Line may appear. As a rule of thumb, the pattern should not be ignored, because it forms a support zone, which may be especially important in the context of bearish patterns where the Bullish Strong Line exists.
The Bullish Strong Line occurs quite often on the charts which make this pattern useful from the trading perspective. However, its efficiency should be evaluated for a particular market/asset.

Figure 2. This example presents a Bullish Strong Line behaving as a bullish reversal pattern.
When a Long Black Candle (being at the same time a Bearish Strong Line) appears, it seems that the bears have control. Indeed, two following candles are moving the market even lower. On the third day after the Long Black Candle occurrence, the Bullish Strong Line is formed. Its appearance did not reverse the trend immediately, but eventually the bulls gained control, what was preceded by a Morning Star appearance.

Figure 3. Another example of the Bullish Strong Line as a bullish reversal pattern.
A Bullish Strong Line is preceded by a Falling Window pattern and an Opening Black Marubozu basic candle. All these formed a resistance zone within which the Bullish Strong Line is formed (along with a Bullish Belt Hold). The pattern appears at a very high trading volume. Although the Bullish Strong Line could not reverse the trend, the bulls and the bears struggle for direction, and the stock moved sideways.

Figure 4. A Bullish Strong Line (formed by the Opening White Marubozu) as a bullish continuation pattern.
The bulls have a pretty easy conditions to continue the trend following the Bullish Strong Line formed at a high trading volume. There is no any resistance area on the horizon and the market goes a bit higher.

Figure 5. Another example of a Bullish Strong Line as a bullish continuation pattern.
Within a downtrend a Falling Window pattern appears, followed by a Bearish Strong Line (formed by the Closing Black Marubozu basic candle). A very strong resistance area is formed, and the bears are in control of the market.
The bulls are struggling for control of the market within the resistance zone, and a Bullish Strong Line is formed. Its aim is to continue an uptrend and cover the price gap but failed due to the Bearish Strong Line formed three months earlier. The stock moved sideways.
Bullish Strong Line statistics
Below you can find some Bullish Strong Line pattern statistics calculated by CandleScanner software.
Scanner settings: daily stocks
Group: S&P500
Number of symbols: 502
Date range: 7/1/1995 - 6/30/2015
Time interval: daily candles
Total number of candlesticks: 2,236,421
Number of occurrences (Bullish Strong Line): 54,063
Number of occurrences (all candlestick patterns): 638,570
% of occurrences (Bullish Strong Line): 8.47 %
Average frequency: 41.4
Efficiency statistics (5 candlesticks testing period)
| Efficiency | NO DATA | FALSE | LOW | MEDIUM | HIGH |
|---|---|---|---|---|---|
| Number of Occurrences |
27 | 10,931 | 15,600 | 10,289 | 17,216 |
| % of Occurrences |
0.05 % | 20.17 % | 28.86 % | 19.03 % | 31.89 % |
| Efficiency | NO DATA | FALSE | LOW | MEDIUM | HIGH |
|---|---|---|---|---|---|
| Number of Occurrences |
93 | 10,175 | 12,095 | 8,827 | 22,873 |
| % of Occurrences |
0.17 % | 18.65 % | 22.37 % | 16.33 % | 42.48 % |
| Occurrences Statistics | 5 candlesticks testing period (HIGH efficiency) |
10 candlesticks testing period (HIGH efficiency) |
||||
|---|---|---|---|---|---|---|
| Symbol | Number of Occurrences |
Average Frequency |
Number of Occurrences |
% of Occurrences |
Number of Occurrences |
% of Occurrences |
| SNDK | 126 | 39.2 | 65 | 51.59 % | 74 | 58.73 % |
| ESRX | 132 | 38.1 | 62 | 46.98 % | 76 | 57.57 % |
| PHM | 134 | 37.6 | 61 | 45.53 % | 76 | 57.46 % |
| CVC | 118 | 42.7 | 52 | 44.92 % | 66 | 56.77 % |
| PWR | 116 | 37.7 | 61 | 52.59 % | 65 | 56.03 % |
| HAR | 146 | 34.5 | 67 | 45.90 % | 81 | 55.48 % |
| AAPL | 128 | 39.3 | 62 | 48.44 % | 70 | 54.68 % |
| KSU | 148 | 34.0 | 56 | 37.84 % | 78 | 52.71 % |
| HUM | 141 | 35.7 | 60 | 42.56 % | 74 | 52.48 % |
| HOG | 124 | 40.6 | 48 | 38.72 % | 64 | 52.42 % |
| Occurrences Statistics | 5 candlesticks testing period (FALSE efficiency) |
10 candlesticks testing period (FALSE efficiency) |
||||
|---|---|---|---|---|---|---|
| Symbol | Number of Occurrences |
Average Frequency |
Number of Occurrences |
% of Occurrences |
Number of Occurrences |
% of Occurrences |
| SIG | 172 | 27.0 | 87 | 50.58 % | 86 | 50.00 % |
| MNST | 184 | 23.8 | 88 | 47.29 % | 88 | 47.29 % |
| GMCR | 172 | 29.0 | 71 | 41.28 % | 71 | 41.28 % |
| ETFC | 130 | 36.5 | 49 | 37.69 % | 49 | 36.92 % |
| REGN | 150 | 33.6 | 56 | 37.33 % | 56 | 37.33 % |
| ALXN | 150 | 32.4 | 52 | 34.67 % | 51 | 34.00 % |
| SWKS | 128 | 39.3 | 41 | 32.03 % | 41 | 32.03 % |
| FOSL | 142 | 35.4 | 45 | 31.69 % | 45 | 31.69 % |
| INTU | 124 | 40.6 | 39 | 31.45 % | 38 | 30.65 % |
| WDC | 141 | 35.7 | 43 | 30.50 % | 43 | 30.50 % |
Scanner settings: daily stocks
Group: S&P500
Number of symbols: 502
Date range: 7/1/2010 - 6/30/2015
Time interval: daily candles
Total number of candlesticks: 614,034
Number of occurrences (Bullish Strong Line): 13,411
Number of occurrences (all candlestick patterns): 166,328
% of occurrences (Bullish Strong Line): 8.06 %
Average frequency: 45.8
Efficiency statistics (5 candlesticks testing period)
| Efficiency | NO DATA | FALSE | LOW | MEDIUM | HIGH |
|---|---|---|---|---|---|
| Number of Occurrences |
27 | 1,994 | 5,206 | 2,915 | 3,269 |
| % of Occurrences |
0.20 % | 14.67 % | 38.82 % | 21.74 % | 24.57 % |
| Efficiency | NO DATA | FALSE | LOW | MEDIUM | HIGH |
|---|---|---|---|---|---|
| Number of Occurrences |
93 | 1,708 | 3,839 | 2,670 | 5,101 |
| % of Occurrences |
0.69 % | 12.05 % | 28.63 % | 19.91 % | 38.72 % |
| Occurrences Statistics | 5 candlesticks testing period (HIGH efficiency) |
10 candlesticks testing period (HIGH efficiency) |
||||
|---|---|---|---|---|---|---|
| Symbol | Number of Occurrences |
Average Frequency |
Number of Occurrences |
% of Occurrences |
Number of Occurrences |
% of Occurrences |
| REGN | 38 | 33.1 | 24 | 63.15 % | 27 | 71.05 % |
| HAR | 32 | 39.3 | 16 | 50.00 % | 21 | 65.63 % |
| VRTX | 32 | 39.3 | 18 | 56.25 % | 20 | 65.62 % |
| ENDP | 40 | 31.5 | 26 | 65.00 % | 26 | 65.00 % |
| NFLX | 40 | 31.5 | 23 | 57.50 % | 26 | 65.00 % |
| PHM | 28 | 44.9 | 15 | 53.57 % | 17 | 64.28 % |
| UA | 30 | 41.9 | 15 | 50.00 % | 19 | 63.34 % |
| ANTM | 30 | 41.9 | 11 | 36.67 % | 19 | 63.33 % |
| JCI | 27 | 46.6 | 13 | 48.15 % | 17 | 62.97 % |
| KSS | 29 | 43.4 | 9 | 31.04 % | 18 | 62.08 % |
| Occurrences Statistics | 5 candlesticks testing period (FALSE efficiency) |
10 candlesticks testing period (FALSE efficiency) |
||||
|---|---|---|---|---|---|---|
| Symbol | Number of Occurrences |
Average Frequency |
Number of Occurrences |
% of Occurrences |
Number of Occurrences |
% of Occurrences |
| HCBK | 28 | 44.9 | 13 | 46.43 % | 11 | 39.29 % |
| FSLR | 35 | 35.9 | 13 | 37.14 % | 13 | 37.14 % |
| LLL | 33 | 38.1 | 10 | 30.30 % | 10 | 30.30 % |
| GNW | 30 | 41.9 | 9 | 30.00 % | 9 | 30.00 % |
| ETR | 35 | 35.9 | 11 | 31.43 % | 10 | 28.57 % |
| FISV | 33 | 38.1 | 9 | 27.27 % | 9 | 27.27 % |
| CNX | 30 | 41.9 | 8 | 26.67 % | 8 | 26.67 % |
| VAR | 27 | 46.6 | 8 | 29.63 % | 7 | 25.93 % |
| VFC | 27 | 46.6 | 8 | 29.63 % | 7 | 25.93 % |
| ISRG | 35 | 35.9 | 10 | 28.57 % | 9 | 25.71 % |

